Introduction
What would happen if a high-magnitude earthquake struck Jakarta—especially Central Jakarta, where numerous high-rise buildings dominate the skyline?
Jakarta sits in a seismically active region and, despite not being directly on a major fault line, the city remains vulnerable to tremors from nearby subduction zones. The growing number of high-rise structures in the city increases the potential for disaster, not only from collapsing buildings themselves but also from the cascading effects of debris and infrastructure failure. In this article, we explore a spatial data analysis study that investigates how many buildings could be affected if high-rise buildings were to collapse during a major earthquake in Central Jakarta.
Using data mining techniques, spatial analysis in QGIS, and open geospatial data from OpenStreetMap (OSM), this study reveals alarming figures—and a need for urgent urban disaster preparedness.
Data Acquisition and Preparation
Sourcing Building Data
The first step in the analysis involved extracting building data from OpenStreetMap using Overpass Turbo, an interface for querying the OSM database. To focus the analysis on significant structures, we filtered the data to include only buildings with more than three floors.
Data Cleaning
We cleaned the dataset by:
- Removing buildings with fewer than four floors.
- Deleting unnecessary tags that are irrelevant to seismic impact modeling.
- Categorizing buildings based on their number of floors.
This filtering step helps isolate high-rise buildings that are likely to pose a significant risk during structural collapse.
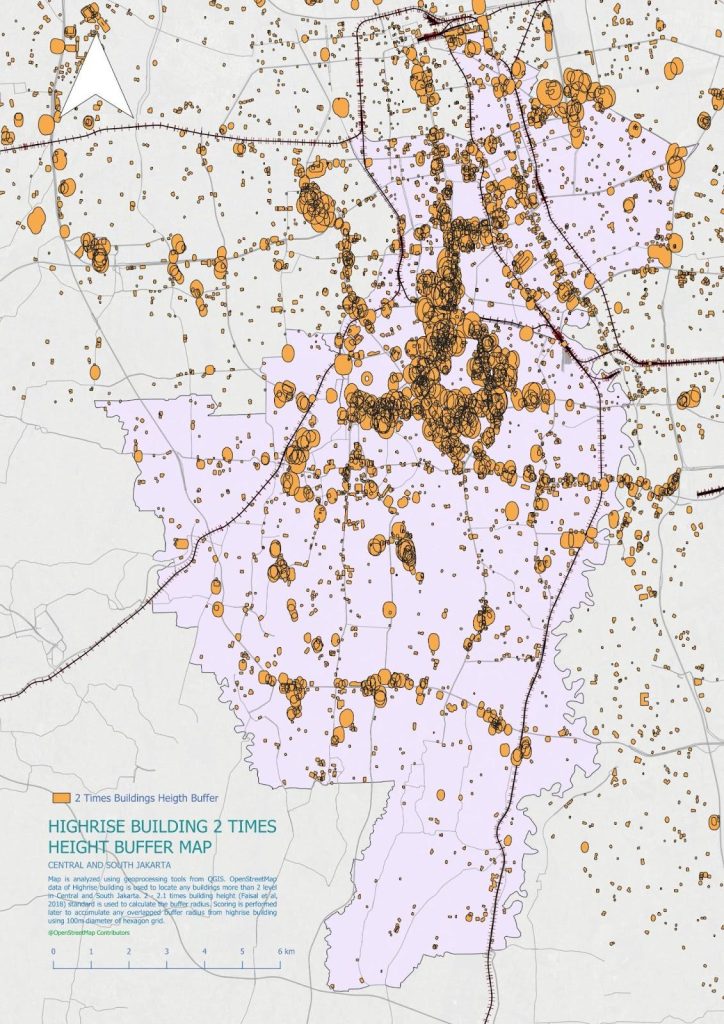
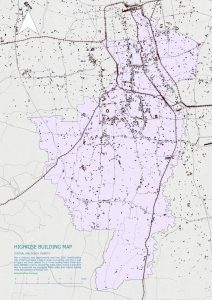
Image of high-rise buildings from OpenStreetMap with its 2.0 times height buffer processed in QGIS.
Impact Radius Modeling
Vulnerability Standards
According to Faisal et al. (2028), the impact radius of a collapsing high-rise can be calculated using a standard multiplier:
2.0 to 2.1 times the building height.
This standard is used to estimate the potential danger zone around a high-rise structure, accounting for falling debris, structural sprawl, and domino effects.
Buffer Generation
Using QGIS, we:
- Calculated the estimated height of each building based on its number of floors.
- Generated buffer zones around each building using the vulnerability distance standard (e.g., 2.1 x building height).
- Created separate buffers for each building level category (e.g., 3-10 floors, 11-20 floors, etc.).
- Merged and overlaid these buffers to visualize the aggregate danger zones throughout Central Jakarta.
Spatial Impact Analysis
Grid System for Quantification
To quantify the potential impact areas, we:
- Created a hexagonal grid overlay with a 100-meter diameter to cover the study area.
- Used spatial joins to determine how many building buffers intersect each hexagon.
- Assigned scores to each grid cell based on the number and severity of buffer intersections.
- Classified the results into five impact classes, ranging from low to very high risk.
This approach allows for a granular understanding of which parts of Central Jakarta are most at risk if a high-rise were to collapse during an earthquake.
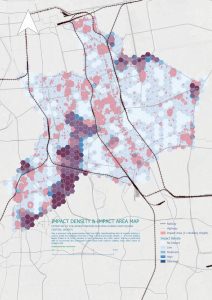
Impact density map of some areas of DKI Jakarta and Central Jakarta only. (Impact Density: Buffer accumulation of high-rise buildings; Impact Area: Coverage area of high-rise buildings buffer)
Results
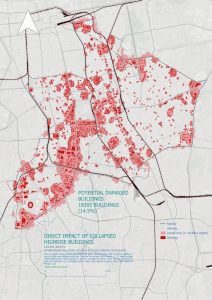
Direct Impact Zones
Buildings located within the immediate collapse buffers are considered to be at direct risk, either from structural failure or being crushed by debris from neighboring buildings.
18,365 buildings (approximately 14.5%) are at direct risk.
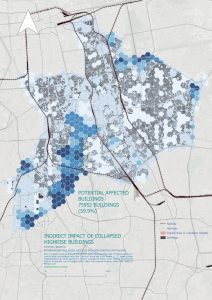
Indirect Impact Zones
These include buildings exposed to secondary hazards such as dust clouds, falling glass, scattered debris, and temporary loss of access.
- 75,952 buildings (approximately 59.9%) are at indirect risk.
Total Potential Impact
Combining both categories, the total number of potentially impacted buildings in Central Jakarta is:
- 94,317 buildings, or 74.4% of all buildings in the area.
Visualizing the Risk: QGIS Map Outputs
Using QGIS, we created a series of thematic maps to visually represent:
- The location and height distribution of high-rise buildings.
- The size and spread of their respective buffer zones.
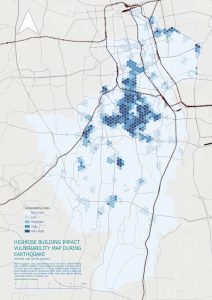
- The classified hexagonal grid showing cumulative risk scores.
These maps provide crucial visual context for urban planners, emergency response teams, and policy makers.

Discussion
Urban Vulnerability
Central Jakarta’s dense urban environment, with numerous tightly packed high-rises, creates a cascading hazard scenario. A single building collapse could result in multi-block devastation—damaging neighboring structures and critical infrastructure like roads, bridges, and utility lines.
Limitations
While this study presents a quick yet data-driven impact analysis, some limitations exist:
- Building material and structural design were not considered due to data unavailability.
- The study uses theoretical impact buffers rather than engineering-based collapse simulations.
- Human activity patterns (e.g., occupancy rates) were not included in the assessment.
Recommendations for Stakeholders
- Emergency Preparedness: Urban authorities must prioritize disaster response drills and infrastructure checks in high-risk zones.
- Zoning Regulations: New high-rise construction must consider buffer zones and minimum spacing.
- Data Updates: Regular updates to building datasets and integration of structural safety scores can enhance future models.
Conclusion and Recommendations
This study demonstrates that a significant proportion of buildings in Central Jakarta—nearly 75%—could be directly or indirectly affected if high-rise structures were to collapse during a major earthquake. The potential scale of destruction highlights the critical importance of proactive urban risk modeling.
A key enabler of this analysis was the use of open spatial data, particularly from OpenStreetMap (OSM). Despite being community-driven, OSM provides a surprisingly rich and up-to-date dataset for urban environments. When paired with open-source GIS tools like QGIS, it becomes a powerful resource for conducting rapid, low-cost, and reproducible spatial assessments—even in regions with limited access to official or proprietary data.
Why OpenStreetMap Matters
- Accessibility: Anyone can access and contribute to OSM, making it ideal for developing nations and research initiatives.
- Customization: The Overpass Turbo interface allows detailed queries to filter buildings based on attributes like height, levels, or type.
- Up-to-date Information: In many urban areas, active mapping communities ensure that data is updated more frequently than some government databases.
By leveraging OSM and QGIS, urban planners, researchers, and disaster mitigation agencies can:
- Quickly identify high-risk zones based on building heights and densities.
- Model realistic hazard scenarios with minimal financial barriers.
- Promote community involvement in urban safety through participatory mapping.
Recommendations
- Integrate Open Data into Disaster Planning
Authorities should formally incorporate open-source spatial data—like OSM—into their risk assessment and emergency preparedness frameworks. - Encourage Public Contribution
Local governments can foster more complete and accurate datasets by encouraging citizens to map their surroundings and report building changes. - Standardize Impact Buffer Modeling
The use of empirical models (like the 2.1× height buffer) should be standardized and published in public guidelines for consistent use across cities. - Develop Open Geospatial Dashboards
Create real-time, interactive mapping dashboards that integrate OSM data with hazard models to support decision-making during emergencies.
In conclusion, open spatial data is no longer just a backup option—it is a critical asset for modern urban resilience strategies. With the right tools and community support, cities like Jakarta can better understand their vulnerabilities and take proactive steps to protect their residents.
Further Reading and References
- Faisal, M., et al. (2028). Seismic Risk and Building Collapse Radius in Urban Areas. Journal of Structural Safety Research.
- OpenStreetMap: https://www.openstreetmap.org/
- Overpass Turbo: https://overpass-turbo.eu/
- QGIS: https://qgis.org/