OpenStreetMap (OSM) has become a cornerstone for digital mapping in Indonesia, supporting humanitarian response, public planning, and digital innovation. With a steadily growing contributor base, the OSM landscape in Indonesia is dynamic, but not without challenges. Data quality remains a pressing issue as the balance between growth and accuracy proves delicate. Drawing from the latest Q1 2025 statistics, we explore four key dimensions of OSM data quality in Indonesia: total warning trends, overlapping object issues, dominant types of mapping errors by province, and the pace of new mapper growth.
1. National Overview: Volume of Mapping Warnings by Province
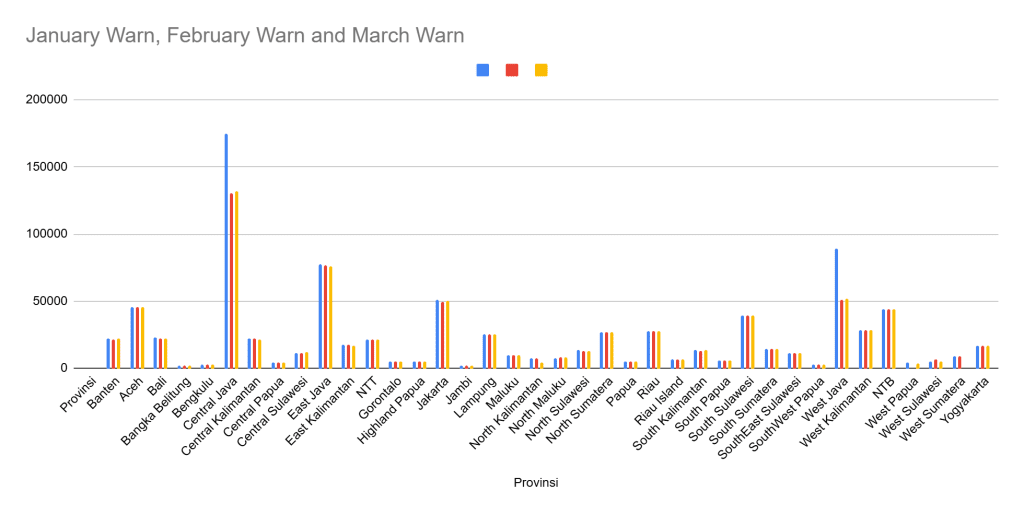
A province-level scan of mapping warnings from January to March 2025 reveals several interesting trends. The top five provinces with the highest number of validation warnings are:
- Central Java: Peaked at 174,732 warnings in January, followed by a steep decline to 130,782 in February.
- West Java: Dropped significantly from 89,334 in January to just over 51,000 in March.
- East Java: Maintained consistently high counts, from 77,388 in January to 76,206 in March.
- South Sulawesi: Remarkably stable across the three months, with just above 39,000 warnings monthly.
- Jakarta: Also stable, hovering around 50,000 warnings.
In contrast, provinces like Bangka Belitung, Jambi, and SouthWest Papua showed low and steady figures, suggesting either fewer mapping issues or minimal editing activity. Notably, provinces such as West Papua and West Sumatra had data gaps in February and March, hinting at potential lapses in validation or reporting.
The warning volume trends suggest a dual scenario: active provinces with large editing communities may accumulate high error counts, while others may reflect under-reporting or low contribution levels.
2. Precision Challenges: Overlapping Object Warnings
Overlapping object warnings provide a focused lens on geometry and spatial integrity. This type of error typically arises when multiple features occupy the same space without logical justification, such as duplicated roads or buildings.
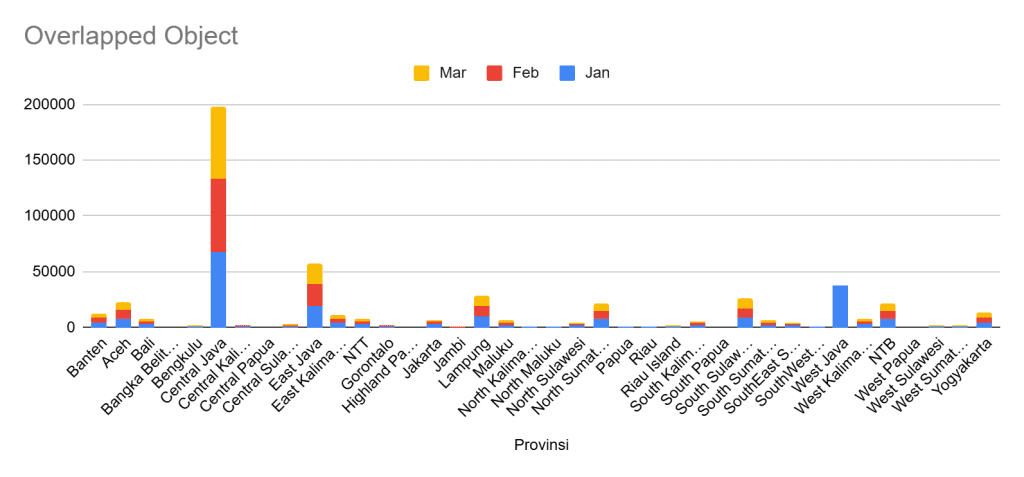
- Central Java again tops this list with over 67,000 overlaps, only slightly decreasing from January to March.
- East Java follows with about 19,000 overlaps, while NTB and Aceh trail closely with approximately 7,000 each.
- Jakarta displayed commendable improvement, cutting overlaps from 3,545 in January to just 1,723 in March.
Provinces like Papua, Central Papua, and South Papua reported overlap numbers below 50, though this may be due to limited mapping activity rather than superior data integrity.
The persistence of overlaps in Central Java and East Java may stem from automated imports, unreviewed mass edits, or a lack of advanced validation by local mappers. In contrast, Jakarta’s significant drop indicates the efficacy of targeted cleanup campaigns or tool-assisted editing (e.g., using JOSM Validator).
3. Understanding Root Causes: Dominant Error Types by Province
Beyond volume, understanding the type of warnings provides insight into deeper structural or systemic challenges. By identifying the leading warning categories in each province, a regional pattern of OSM data quality emerges:
- Object Overlap: Central Java (25,742), Riau (8,921), Lampung (6,842), and Central Kalimantan (6,738) stand out. These numbers underscore the widespread nature of geometry-related issues.
- Deprecated Tags: Predominant in Aceh (16,290), NTB (6,991), and South Sulawesi (6,894). This likely results from outdated editing practices or a lack of tag standardization training.
- Street Number Issues: Prominent in NTT (5,281), North Sumatra (6,204), and Gorontalo (1,101). These reflect inaccurate or incomplete address tagging.
- Approximate Ways: Concentrated in Papua, Central Papua, and Highland Papua, where satellite imagery is scarce or poorly aligned.
- Local Language Tagging Issues: Extremely high in Jakarta (26,138) and West Java (15,626), hinting at inconsistencies in the use of name, name:en, and name:id tags.
- Powerlines & Infrastructure Tag Errors: Seen in East Java and West Kalimantan, indicating either misclassification or infrastructure mapping without full integration.
- Orthographic Errors: Found only in Yogyakarta (1,999), likely stemming from local naming inconsistencies or typographical mistakes.
These patterns indicate that data quality issues are highly localized. Urban centers face different challenges from remote provinces, and provinces with high editing activity are more exposed to advanced tagging errors or mass-edit mistakes.
4. Mapping Momentum: New Mapper Growth
The final component of the analysis is the community behind the maps. New mapper counts for early 2025 show a gradual decline:
- January: 380 new mappers
- February: 291
- March: 253
While a healthy number of new contributors were added, the downward trend suggests a plateau in community growth. This could be due to post-pandemic digital fatigue, lack of community events, or absence of onboarding initiatives. It also reflects the need for sustained outreach, mentorship, and community-led mapathons to keep new contributors engaged.
The correlation between mapper influx and data quality is nuanced. New users often introduce common errors due to inexperience, which explains the concentration of geometry and tagging issues in high-growth provinces. However, without active validation and mentoring, these errors can persist and accumulate.
Strategic Recommendations
To elevate mapping quality in Indonesia, a multifaceted strategy is needed:
- Targeted Validation Campaigns Launch province-specific cleanup drives using tools like JOSM Validator and MapRoulette, especially in Central Java, Riau, and NTB.
- Tagging Standardization Workshops: Organize regional training sessions to address deprecated tags and naming inconsistencies. Localized tagging guides should be developed in Bahasa Indonesia and other regional dialects.
- Field Survey Expansion For provinces with approximate geometries (e.g., Papua), invest in field surveys using mobile apps like Organic Maps or StreetComplete.
- Mentorship and Onboarding Combat the slowdown in new mapper growth by launching digital onboarding kits, local mentorship programs, and monthly mapathons in schools and universities.
- Data Visualization and Feedback Share visual dashboards and province-level feedback loops to help contributors understand the impact of their edits and areas needing improvement.
Conclusion: Mapping Beyond the Numbers
Indonesia’s OSM ecosystem is maturing, but with that growth comes a need for careful stewardship. The first quarter of 2025 paints a picture of both promise and challenge: vibrant community growth shadowed by quality inconsistencies. By investing in regional validation, targeted training, and sustained contributor support, Indonesia can not only reduce mapping errors but also become a beacon of quality mapping for the entire Southeast Asian region. As OSM continues to underpin disaster response, urban planning, and civic tech initiatives, ensuring its quality isn’t just a technical concern, it’s a national imperative.